
Legal rate data is becoming harder to summarize with a single headline. While overall rates continue to rise, the more useful story is increasingly found beneath the averages: which industries are absorbing the greatest pricing pressure, which firms continue to gain pricing leverage, and which categories of legal work are driving costs higher.
Rather than treating rate growth as a single market trend, this analysis examines where pricing pressure concentrated in 2025 and what early 2026 invoice data is beginning to reveal across industries, firm tiers, practice areas, and cities.
A note of caution is important. Early-year rate data can be directionally useful, but it is not always predictive. In the first quarter of 2025, overall rate growth was tracking at 3.5%; by year-end, that figure had reached 5.6%. Because updated rates often enter invoice data gradually throughout the year, the trends discussed here should be viewed as signals to monitor rather than conclusions to lock in.
One theme is becoming increasingly clear: legal rate behavior is no longer best understood through broad market averages.
Industry, firm selection, practice area, and geography are having a growing influence on legal costs. As a result, meaningful benchmarking requires greater precision than ever before.
The cost of complexity: the industries facing the biggest disruption also faced the biggest rate increases
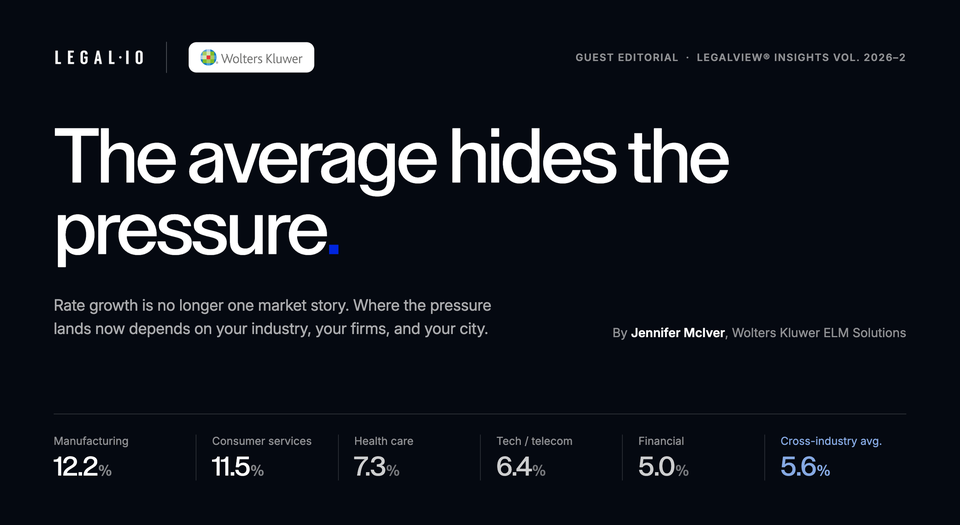
The industry-level data for 2025 is striking, primarily because the biggest rate increases landed in sectors that were already absorbing significant business disruption. Manufacturing led all industries with a 12.2% average rate increase, pushing average blended timekeeper hourly rates from $673 to $765 — approximately 15% above the cross-industry average.
Partner rates for manufacturing clients were not the highest on an absolute basis, averaging $965 per hour, but the third-quartile partner rate of $1,340 was the highest of any industry. Manufacturing companies in 2025 were navigating what can be described as a perfect storm: tariff volatility, rising import costs, supply chain disruption, and expanding regulatory pressure all at once. That combination increased the complexity, stakes, and risk of their legal needs, and rate increases followed accordingly.
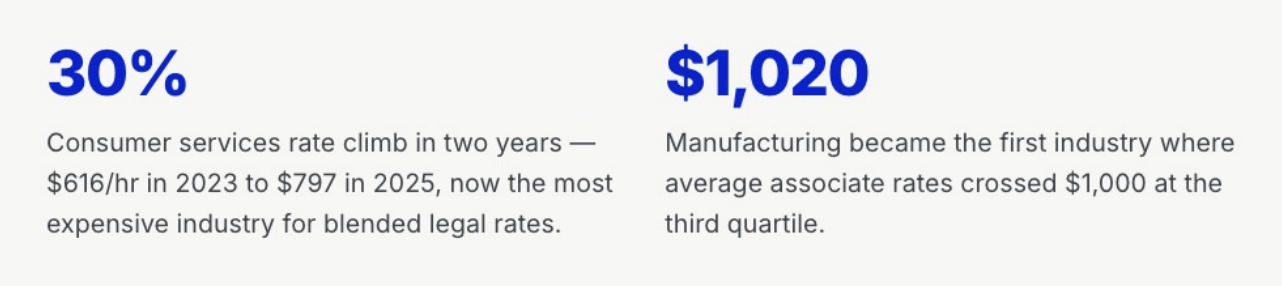
The consumer services industry was not far behind, with an 11.5% rate increase in 2025. What makes this figure particularly notable is context: consumer services had already absorbed a 16.1% increase in 2024. Two consecutive years of double-digit rate increases represent a significant cumulative impact for in-house legal departments.
Associate rates in both manufacturing and consumer services increased at a higher percentage than partner rates, consistent with a broader trend seen across the Am Law tiers. Associates working on manufacturing matters increased 18.9%, while those working on consumer services matters saw a 14% increase.
Year-to-date 2026 data is beginning to tell its own story, though it is early. Two industries worth watching are health care and technology/telecom, currently tracking rate increases of 11.1% and 9.5%. Both posted moderate increases in 2025 (7.3% and 6.4%), so the early 2026 data suggests a potential step-up — possibly reflecting ongoing regulatory activity in health care, or the legal and transactional demands tied to AI and technology investment.
The Am Law divide widens: premium firms keep raising rates while the rest of the market bears watching
Among Am Law-ranked firms, 2025 continued a pattern of differentiated behavior across the tiers. Am Law 26–50 firms posted the highest rate increases for the second consecutive year, at 10.2%. For those tracking whether that tier is closing the gap on the top 25, the short answer is: somewhat, slowly.
The most pronounced rate cliff remains the drop from the top 50 into the 51–100 tier. Blended hourly rates for Am Law 51–100 firms average $678, approximately 29% below the $955 average for Am Law 26–50 firms. When you look specifically at partner rates, that gap widens to 31%.
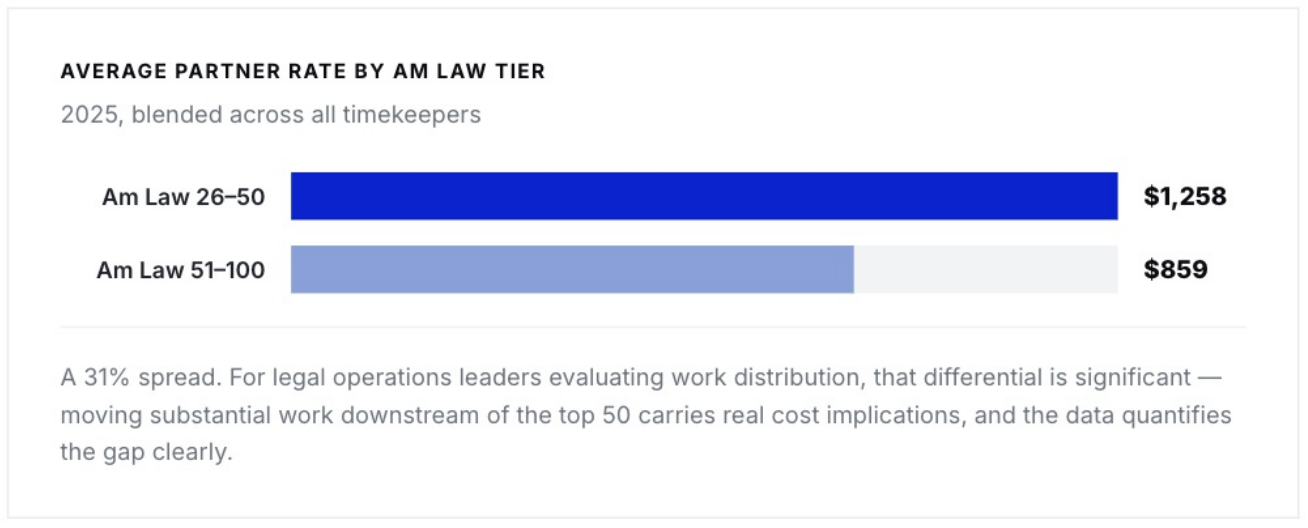
A 31% spread. For legal operations leaders evaluating work distribution, that differential is significant — moving substantial work downstream of the top 50 carries real cost implications, and the data quantifies the gap clearly.
What is new, and worth flagging, is that 2026 YTD data is showing rate decreases for associates at the lower Am Law tiers and at non-ranked and boutique firms. The most pronounced movement is at the Am Law 151–200 level, where associate rates are showing a 10.2% decrease, dropping from an average of $434 per hour to $390. The practice areas most associated with this decrease include corporate work and real estate.
It is too early to draw firm conclusions, but a few possible explanations are worth considering: associate turnover at lower-tier firms, client-driven rate renegotiations, or — and this is one to watch — the early pricing impact of AI on standardized associate work. Wolters Kluwer ELM Solutions will be digging deeper into this, examining the types of matters these associates are working on and whether the work itself is shifting in ways consistent with AI-driven task displacement.
A more selective rate market is emerging: premium work climbs while other areas cool
Corporate legal work remains the most expensive area of legal service delivery, consistently and across industries and years. That did not change in 2025, when corporate work saw rate increases of 9.8% and 10.6% in 2024 and 2025 respectively. Early 2026 data shows corporate rates continuing at a 9.9% pace, with average blended hourly rates at $936 and third-quartile partner rates across all firm sizes at $1,469.
Finance and securities work tells a different early-2026 story. Year-to-date, mean blended rates have dipped slightly from $837 to $826 — a modest decline, but directionally notable given the consistent upward pressure this area has seen in prior years. Commercial transactions and agreements, as well as bankruptcy and collections, are also showing slight rate decreases thus far in 2026.
Two types of work stand out for rate increases in 2026: information technology, up 14.5%, and international legal matters, up 12.7%. International matters are among the few matter types with a blended hourly rate above $1,000, at $1,057. Given the current environment — ongoing trade tensions, regulatory divergence across jurisdictions, and complex global M&A activity — elevated rates for cross-border work are not surprising.
There are early signs that generative AI may be beginning to affect pricing. Within information technology work, the areas most associated with AI-assisted tasks — general drafting and review — are showing a year-to-date decrease of 2.1%.
That is a small number, and it is early, but it is worth watching. Similarly, regulatory and compliance rates are showing a slight 0.9% decline, consistent with the easing of some enforcement pressure that drove high increases in that area in prior years. A softer enforcement climate in 2025 appears to be flowing through to rate behavior in 2026.
The most expensive markets aren’t driving the highest growth
New York City and Washington, D.C. continue to hold the highest blended hourly rates of any U.S. city — $993 and $979 respectively as of early 2026. Both are approaching the $1,000 average threshold, which would be a meaningful psychological and practical milestone. Third-quartile partner rates in New York are closing in on the $2,000 mark at $1,949.
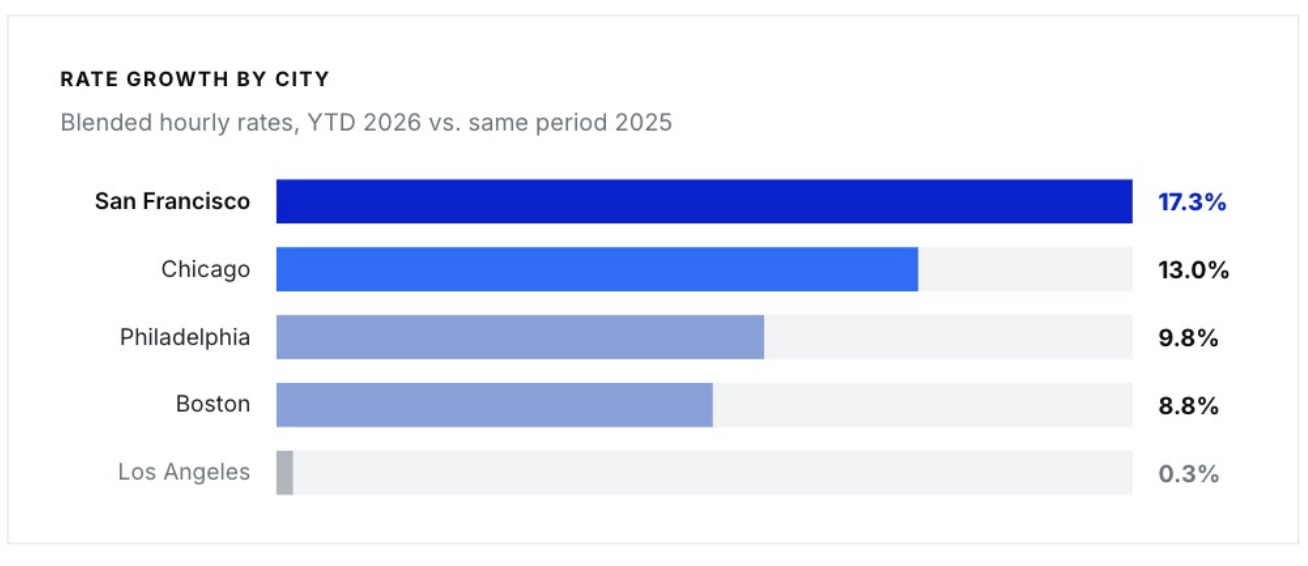
What is new in early 2026 is that New York is no longer at the top of the rate-increase list. That distinction now belongs to San Francisco, tracking a 17.3% increase year-to-date, with third-quartile partner rates reaching $1,504 — surpassing comparable rates in Washington, D.C. and Chicago.
San Francisco leading rate increases is not entirely a surprise. Technology and AI have moved to the top of nearly every corporate legal team’s priority list, whether for internal governance, transactional support, regulatory compliance, or litigation exposure. The Bay Area concentration of tech-driven legal demand is showing up clearly in these rates, and I expect this to be a pattern we continue to see as AI-related legal work grows.
Looking ahead: the next evolution of legal benchmarking
The data confirms that legal rate growth is no longer a single-market story. Manufacturing and consumer services absorbed some of the largest increases in 2025, while health care and technology-related work are showing early signs of acceleration in 2026. The premium commanded by top-tier firms remains substantial, yet portions of the lower-tier market are exhibiting patterns that warrant closer attention. Even at the city level, the highest-priced markets are not necessarily the markets experiencing the strongest growth.
The broader signal is becoming clearer: broad market averages are becoming less useful as standalone benchmarks. The legal departments best positioned to manage spend will be those that understand where rate pressure is developing within their own portfolio of work, firms, industries, and geographies — rather than relying solely on market-wide trends.
Understanding what firms charge remains important, but it is no longer enough. Increasingly, legal departments want to understand how work is staffed, where efficiency is being created, how technology is influencing service delivery, and ultimately whether higher costs are resulting in better outcomes and greater value.
The next generation of legal benchmarking will not simply measure what legal services cost. It will help legal departments understand how they are delivered, where value is created, and how top-performing organizations are adapting.
The legal market is changing. The questions legal leaders need answered are changing with it.